
Commentary: Long-term Outcomes of Patients With Ground-Glass Opacities Detected Using CT Scanning Can we predict future tumor growth at the time of the first hospital visit?
Shigeki Sawada1*
1Department of Thoracic Surgery, Japanese Red Cross Society Himeji Hospital, Japan
Background
With the development of CT technology and the initiation of CT screening for lung cancer, many small nodules, especially ones exhibiting ground glass opacity (GGO) on CT images, are now frequently detected. How these small nodules should be managed remains a topic of interest. We previously reported the results of a long-term follow-up of 243 patients with pure or mixed GGOs of 3 cm or smaller in size1. Of these 243 patients, 39 patients showed tumor growth during the follow-up period. In contrast, 82 patients did not exhibit any tumor growth during the follow-up period. The identification of GGOs with a high likelihood of future growth or stable disease at the time of the first hospital visit would be both interesting and helpful. We therefore analyzed the data of the previous study and attempted to identify clinical factors that were associated with future tumor growth or stable disease.
Methods
This additional analysis was performed based on the data of the previous study1. To identify factors associated with tumor growth during the follow-up period, a regression tree model was used to examine the patient groups with or without tumor growth during the follow-up period2-4. Information on clinical data including the follow-up period, tumor appearance, tumor behavior during the follow-up period, patient age, and sex were obtained from our previous study. In the present analysis, patient age, sex, tumor size, and a ratio of the diameter of consolidation relative to the tumor diameter (CTR) were considered as variables that were potentially associated with tumor growth and were analyzed using a regression tree method and classified into subgroups according to the frequency of tumor growth. A logistic regression analysis was performed to confirm any statistical differences among the patient populations that were created by the regression tree analysis. The statistical analyses were performed using JMP Ver. 12 (SAS Institute, Cary, NC, USA). P values <0.05 were considered statistically significant.
Patient groups with tumor growth or stable disease
Patients who did not show any tumor growth for more than 5 years were included in the patient group with stable disease. Of the 243 patients, 68 patients did not show tumor growth for more than 5 years and were included in the patient group with stable disease. Of the 243 patients, 39 patients showed tumor growth during the follow-up period and were included in the patient group with tumor growth. In total, 107 patients were evaluated in the regression tree analysis to identify factors associated with tumor growth.
Results
The results of the survival tree model are shown in Fig. 1. Patient age, tumor size, and CTR factors were selected as variables in the split steps, but sex was not selected. The first split was produced by the tumor size factor, and patients were separated according to whether they had a tumor size ≥9 mm (versus <9 mm). The second split in the tumor size ≥9 mm branch was made according to patient age (<58 years versus ≥58 years). In the tumor size <9 mm branch, the second split was made according to the CTR factor (0 versus 0.25/0.5/>0.5). Finally, the 107 patients were classified into 4 subgroups, as follows: Group A, tumor size ≥9 mm and age <58 years; Group B, tumor size ≥9 mm and age ≥58 years; Group C, tumor size <9 mm and CTR0; and Group D, tumor size <9 mm and CTR0.25/0.5/>0.5. The probability of tumor growth was highest in Group B (P = 0.668), followed by Group D (P = 0.5565). In contrast, Group C had the lowest risk of tumor growth. A logistic regression analysis confirmed that Group B had a significantly higher risk of tumor growth than Groups A or C, while Group C had a significantly lower risk, compared with the other 3 groups (Table 1). These results suggest that patients with a tumor size ≥9 mm and an age ≥58 years have a high risk of tumor growth. In contrast, patients with a tumor size <9 mm and a CTR = 0 have a low risk of tumor growth.
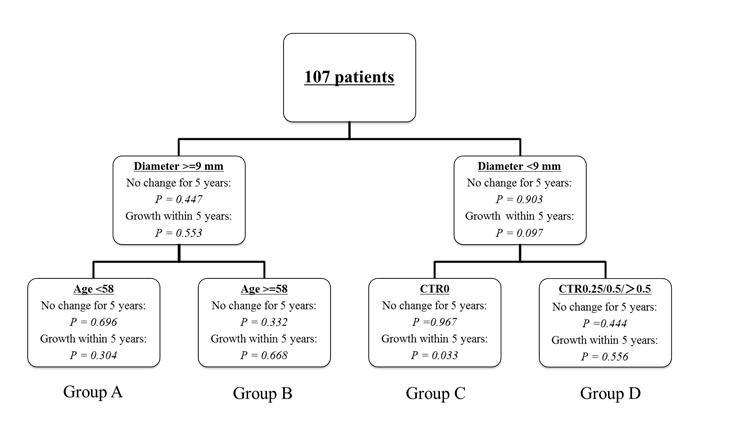
Figure 1: Regression tree model. CTR: maximum diameter of consolidation relative to the maximum tumor diameter.
Table 1: Logistic regression analysis of Groups B and C
| Variables | Odds ratio | 95% CI | P |
|---|---|---|---|
| Group B | Reference | Reference | |
| Group A | 0.207 | 0.062 - 0.629 | 0.005 |
| Group C | 0.013 | 0.001 - 0.068 | <.0001 |
| Group D | 0.725 | 0.108 - 5.968 | 0.742 |
| Group C | Reference | Reference | |
| Group A | 16.29 | 2.487 - 322.2 | 0.002 |
| Group B | 78.71 | 14.68 - 1469 | <.0001 |
| Group D | 57.00 | 5.024 - 1539 | 0.001 |
CI = confidential interval
Comments
The Cox proportional hazards analysis and logistic regression analysis are commonly used for multivariate analyses in many medical studies. The primary assumption in a Cox proportional hazards analysis is that the hazard functions of all the data groups are proportional to one another. The regression tree model makes no assumption of proportional hazards; through a precise and complex program, it segregates groups by sequential partitioning based on statistical parameters related to the number of events (tumor growth in this analysis), allowing the progressive segregation of smaller groups with statistically significant differences. The regression tree model, therefore, can identify meaningful prognostic subsets (subpopulations) in a study population that usually do not emerge from a routine proportional hazards analysis. In short, the Cox proportional analysis or logistic regression model are methods for identifying a variable that is associated with a certain result (for example, a factor associated with a long OS or RFS), while the regression tree model can identify a subpopulation that is mostly associated with certain results (for example, a patient population associated with a high-risk of recurrence or a high-risk of tumor growth, as in the present study).
In this analysis, patients who did not show any tumor growth for more than 5 years were included in the patient group without tumor growth. We preliminarily evaluated when tumor growth was detected during the follow-up period (Table 2). Of the 39 patients who showed tumor growth, 38 patients showed tumor growth within 5 years. We assumed that the possibility of tumor growth thereafter would be very low in patients with stable disease for 5 years or more. Therefore, we decided to use this patient group as a representative of stable disease.
Table 2: Time interval until detection of tumor growth
| Time interval until detection of tumor growth | 39 |
| Within 1 year | 18 |
| 1-2 years | 10 |
| 2-3 years | 8 |
| 3-4 years | 2 |
| 4-5 years | 0 |
| 9 years | 1 |
This analysis was performed using a statistical method based on a small number of data points. While the feasibility of this analysis was not confirmed, GGOs with a tumor size <9 mm and a CTR = 0 are likely to be correlated with a low risk of tumor growth, which is very consistent with our clinical experience. We have added this suggestion as a comment on the results of our previous study.
References
- Sawada S, Yamashita N, Sugimoto R, et al. Long-term Outcomes of Patients With Ground-Glass Opacities Detected Using CT Scanning. Chest. 2017; 151(2): 308-15.
- Davis RB, Anderson JR. Exponential survival trees. Stat Med. 1989; 8(8): 947-61.
- LeBlanc M, Crowley J. Relative risk trees for censored survival data. Biometrics. 1992; 48(2): 411-25.
- Segal MR, Bloch DA. A comparison of estimated proportional hazards models and regression trees. Stat Med. 1989; 8(5): 539-50.